Entre em Contato com a Masstech

Reviewed by Mass Technology engineering team · Published 2026 · Last updated May 2026
RO water treatment is a pressure-driven membrane process that removes 95-99% of dissolved solids and most chemical contaminants from feed water. It powers everything from a single under-sink filter to a 50 ton-per-hour bottling line, and the technology has stayed the engineering backbone of high-purity water for more than si× decades. This guide e×plains how the process works, what it removes, the engineering metrics that decide whether a system performs, and where the technology is heading in 2026.
Quick Specs: RO Water Treatment at a Glance
| Process type | Membrane filtration, pressure-driven, cross-flow |
| Contaminant removal | 95–99% of dissolved solids; up to 99% of certain PFAS |
| Operating pressure | ≥40 psi residential; 100–1,000+ psi industrial / seawater |
| Recovery rate (commercial) | 50–85%, depending on feed water chemistry |
| Membrane life | 2–3 years residential; 3–5+ years industrial with proper pre-treatment |
| Wastewater ratio | 2.3:1 (WaterSense labeled) to 5:1 typical, up to 10:1 inefficient |
| Key standards | NSF/ANSI 58-2022 (POU RO), EPA WaterSense (Nov 2024), USP <645> (pharmaceutical) |
| Common industries | Beverage, pharmaceutical, semiconductor, boiler feed, metal finishing |
What Is RO Water Treatment?

Reverse osmosis (RO) water treatment is a purification process that forces water through a semi-permeable membrane under pressure, separating water molecules from almost everything else dissolved or suspended in them. The treated water that passes the membrane is called permeate; the concentrated reject stream that carries the contaminants away is called concentrate or brine. The U.S. Environmental Protection Agency defines a point-of-use RO system as a filtration device connected to a single fixture that uses this same membrane-based separation to remove contaminants from a household water supply.
Osmosis vs. Reverse Osmosis
To understand why this matters, the natural process of osmosis has to come first. In osmosis, water moves through a semi-permeable membrane from a less concentrated solution toward a more concentrated one until both sides equalize. It is the same mechanism that lets plant roots draw water from soil. Reverse osmosis flips that. Apply enough external pressure to the concentrated side, and water is pushed in the opposite direction – away from the dissolved salts, organics, and contaminants – and emerges on the other side as purified water.
How much pressure depends on the feed water salt concentration. Brackish well water needs far less than seawater. Municipal tap water may need only 50-60 psi; a seawater desalination plant may run 800-1,000+ psi. Either way, the membrane stays the same fundamental component: an extremely thin polymer film with pores small enough to block ions, salts, and most organic molecules while letting water molecules through.
“The scientist recognized as the grandfather of the RO membrane process is Sidney Loeb M.S. ’59, Ph.D. ’64, who was a UCLA doctoral student when, working with Srinivasa Sourirajan, he produced the first asymmetric cellulose acetate membrane that made practical reverse osmosis possible.”
— UCLA Newsroom, on the 1959 invention that launched modern water purification
How Does Reverse Osmosis Work?

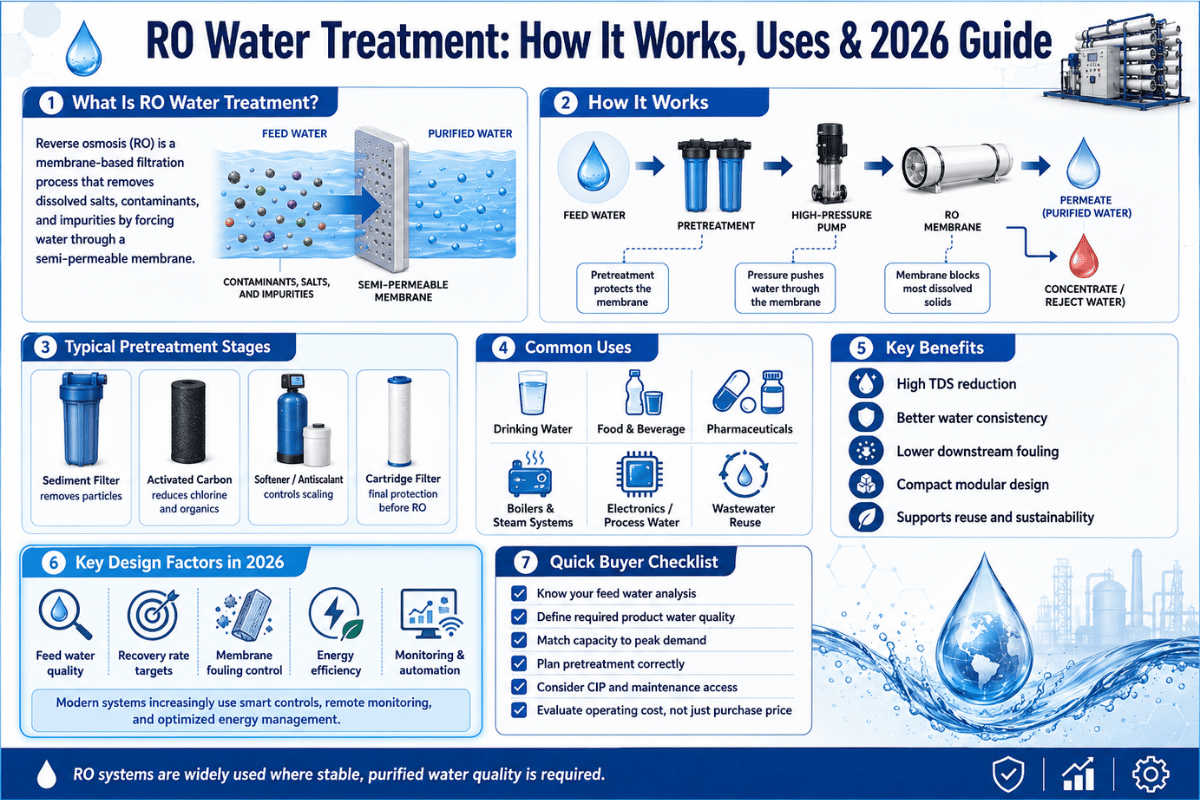
An RO system is, at its core, a controlled pressure problem. Feed water enters, pressure forces it across a membrane, and two streams come out: clean permeate going to a tap or process, and concentrate going to drain. It looks short on paper. In practice, every functioning RO system runs the same five stages.
- Pre-filtration. Sediment and carbon pre-filters remove particulates and chlorine. Chlorine is critical – modern thin-film composite membranes degrade rapidly when exposed to it.
- Pressurization. A high-pressure pump pushes water against the membrane. Pressure must exceed the natural osmotic pressure of the feed water or no permeate is produced.
- Membrane separation. Water molecules pass through the semi-permeable film. Dissolved salts, organics, and most microorganisms stay behind in the concentrate stream.
- Storage. Permeate flows into a pressurized storage tank because the membrane produces water slowly — a residential system delivers only 2–3 ounces per minute.
- Post-filtration. A polishing carbon filter sits between tank and faucet to catch any tastes or odors the water picked up during storage.
What Is the Difference Between Stages and Passes in RO?
Stage and pass are easy terms to confuse, but they mean different things — and choosing between them is a real engineering decision.
A stage refers to the number of times the concentrate stream is cycled through in a single RO unit. In a one-stage configuration, feed water enters the first element, separates into permeate and concentrate and leaves the system. In a two stage—also known as 2:1—configuration, that concentrate stream becomes the feed for the second stage. Both permeate streams are then combined. With each stage added, the overall recovery—the percentage of feed water that emerges as permeate—gets higher. Industrial-scale units run two stages in a 2:1 array (the concentrate of 2 parallel pressure vessels feeds another downstream vessel).
A pass refers to the number of complete RO systems the water material passes through in sequence. In a double-pass, the permeate from pass one is recirculated back into a second, complete RO unit for additional polishing. This is how ultra-high purity applications—like pharma grade water, semiconductor manufacturing, or boiler feed water for high-pressure turbines—are able to produce permeate quality that would be impossible in one pass.
| Configuration | Primary Goal | Typical Use Case |
|---|---|---|
| Single-stage, single-pass | Basic separation | Residential, light commercial |
| Two-stage, single-pass | Higher recovery | Industrial, beverage, brackish water |
| Single-stage, double-pass | Higher purity | Pharmaceutical, electronics |
| Two-stage, double-pass with EDI | Ultra-pure water | Semiconductor, power plant boiler feed |
What Contaminants Does RO Remove?
An RO membrane operates on the principle that molecules can be separated by size and ionic charge. Heavier than 200 daltons, or strongly charged ions, will be rejected. This includes most contaminants of concern in industrial and drinking water applications.
| Contaminant Class | Examples | Typical Removal |
|---|---|---|
| Dissolved salts (ions) | Sodium, chloride, sulfate, nitrate | 95–99% |
| Heavy metals | Lead, mercury, arsenic, chromium | 95–99% |
| Synthetic chemicals | PFAS, VOCs, pesticides, microplastics | Up to 99% (PFAS, certain compounds) |
| Inorganic compounds | Fluoride, hardness ions | 85–95% |
| Microorganisms (size-based) | Bacteria, protozoa, most viruses | Mechanical exclusion — not certified for microbiological safety alone |
| Dissolved gases | CO₂, hydrogen sulfide, dissolved O₂ | Minimal — gases pass freely |
Does RO Remove PFAS?
Yes — and this is one of the fastest-growing segments in the 2026 RO market. According to EPA WaterSense documentation, reverse osmosis is up to 99% effective at removing certain PFAS compounds. Peer-reviewed research published through the National Library of Medicine documents that municipal drinking water utilities are increasingly adopting RO specifically because of its consistency at removing perfluoroalkyl micropollutants.
Two practical caveats matter: removal efficiency is lower in real-world feed water than in laboratory synthetic water because natural organic matter causes membrane fouling, and there are still PFAS compounds present in the brine stream that flows into the environment—so disposal becomes a PFAS mitigation step, in addition to handling hazardous waste. Though not an issue for residential systems, this is an active consideration when designing industrial grade systems for recycling the concentrate.
️ What RO Cannot Remove
Dissolved gases like carbon dioxide, hydrogen sulfide, and radon pass freely through the membrane because their small molecular size and minimal ionic charge let them slip through. CO₂ dissolves on the permeate side as carbonic acid, which lowers pH slightly. Systems that need ultra-pure water add a degasifier stage before downstream polishing — or inject caustic between passes in a double-pass setup to convert CO₂ to carbonate ions that the second pass rejects.
RO System Components and How They Connect

All RO units—whether $200 final cap under-the-sink, or 50 ton per hour juice producing brewery skid—share the same core components. Size, materials, and the level of automation around them are what change.
| Component | Function | Notas |
|---|---|---|
| Sediment pre-filter | Removes particulates 5–20 microns | Protects downstream membrane from physical fouling |
| Activated carbon pre-filter | Removes chlorine, chloramines, organics | Essential for thin-film composite membrane survival |
| High-pressure pump | Generates feed pressure above osmotic pressure | Variable frequency drive recommended to avoid hard starts |
| RO membrane | Performs the separation | Thin-film composite polyamide (TFC); housed in pressure vessels |
| Membrane housing (pressure vessel) | Holds membrane elements | Industrial vessels hold 1–6 elements per housing |
| Flow restrictor / concentrate valve | Maintains back-pressure on reject side | Sets the recovery ratio for the system |
| Permeate storage tank | Buffers slow membrane production | Pressurized at 7–8 psi when empty for proper delivery |
| Post-filter / polish | Final taste and odor correction | Often activated carbon; remineralization filter is optional |
| Permeate pump / booster pump (optional) | Reuses concentrate energy to push permeate to tank | Can reduce wastewater by 75–80% in supported residential systems |
The membrane is ultimately the engineering core. TFC membranes introduced widely during the early 1980’s, are 3-ply films composed of a polyester support, a microporous polysulfone interlayer and a densely packed polyamide barrier film (~200nm). This polyamide film is that which rejects and it is this film that does not take kindly to chlorine hence the importance of pre-filtration.
Engineering Performance: Recovery, Salt Rejection, and Flux Rate
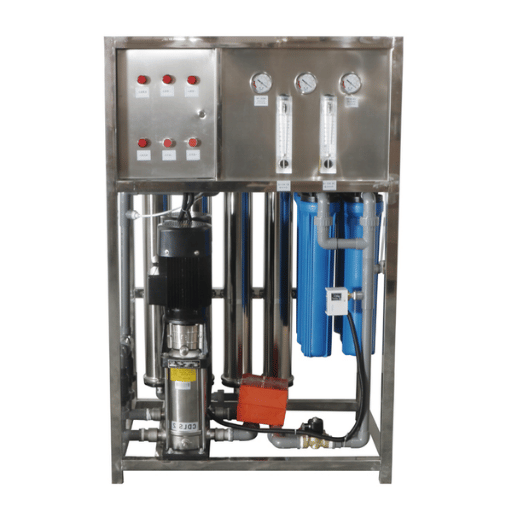
For an engineer, three numbers indicate if an RO system is healthy and well built and if it is making the water it should: salt rejection percentage, recovery and flux. The same three figures are ones which most residential buyers never get to see but that make the difference between a commercially or industrially profitable system or not.
Salt Rejection Percentage
Salt rejection is a measure of how well the membrane is removing dissolved ions. An optimized, healthy membrane system will reject 95-99% of the salts in the feed water.
Salt Rejection % = ((Feed conductivity − Permeate conductivity) / Feed conductivity) × 100An increasing salt passage—that is, decreasing rejection—indicates one of three conditions: membrane fouling, chemical attack, or end of service life. Factory baseline rejection is established at system start-up, and then monitored monthly. Conventional action is taken when there is a normalized decrease of 15% from baseline.
Recovery Rate
The recovery rate is the ratio of feed water to permeate passing to make the system in the permeate stream rather than to drain.
Recovery % = (Permeate flow / (Permeate flow + Concentrate flow)) × 100Commercial ro’s normally run between 50-85% depending on the feed water chemistry. A municipality feed water with low hardness and low silica could drive a high recovery of up to 85%. A high silica well water would likely need to operate at a lower percentage of about 50% to prevent scaling.
Seawater ro’s generally run about 40-50% because the osmotic pressure at higher rejection is generally prohibitive.
📐 Engineering Note: The Recovery-Concentration Trade-off
Higher recovery of course saves water – but it concentrates everything in the reject stream as well. The concentration factor is related to recovery by: Concentration Factor = 1 / (1 Recovery). The rejection is a factor of about 5 at 80% recovery; 10 at 90%.
Pass the solubility limit of any of the scale forming species (CaCO, CaSO, silica) and the membrane scales, salt passage increases and flux collapses. “Design for as much recovery as possible” is the most common mistake in industrial RO design. “Design for the highest recovery the feed water chemistry can sustain without scaling” is the correct framing.
Flux Rate (GFD)
Flux rate is the rate of flow of water through each square foot of membrane surface area in gallons per square foot per day (GFD) or liters per square meter per hour (LMH). It is too low, and the system is undersized for the application; it too high, and the membrane fouls rapidly by forcing water across it at a rate faster than the cross-flow can scour away contaminants.
Flux (GFD) = (Permeate flow gpm × 1,440) / (number of elements × element area ft²)Both the minimum and maximum flow rates (flux) are determined solely by feed water quality. Based on common industry practice:
| Feed Water Source | Recommended Flux (GFD) |
|---|---|
| RO permeate (second pass feed) | 20–30 |
| Brackish well water | 14–18 |
| Brackish surface water | 10–14 |
| Sea water | 8–12 |
| Sewage / wastewater effluent | 5–10 |
Running flux above the suggested range is the single fastest way to cut membrane life short. it is also one of the most common ways an undersized system gets specified at quote time—by sizing for nameplate permeate flow without enough membrane area to deliver it at sustainable flux.
Pre-Treatment for RO Systems: Why It Matters
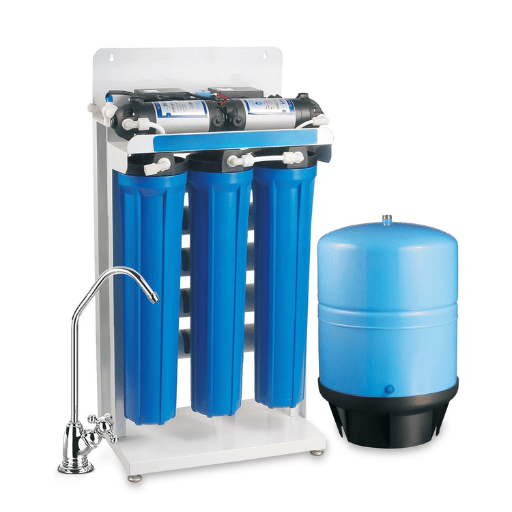
RO membrane is a high-precision separation device that fails fast with dirty feed water. Pre-treatment is what separates the feed water from that high-precision device. Skip it, undersize it, specify the wrong one, and the system won’t make its rated lifespan. Four failure modes drive nearly every pre-treatment decision.
| Problem | Root Cause | Pre-Treatment Solution |
|---|---|---|
| Fouling | Particulates, organics, biofilm, broken filter media | Multi-media filter; microfiltration; activated carbon |
| Scaling | Hardness exceeds solubility (commonly CaCO₃) | Antiscalant injection; ion exchange softener |
| Chemical attack | Chlorine or chloramines reach polyamide layer | Sodium bisulfite (SBS) injection; granular activated carbon |
| Mechanical damage | Hard pump starts, backpressure spikes | Variable frequency drives; pressure relief valves; check valves |
When to Use Each Pre-Treatment Method
Industry practice relies on two measures of feed water quality to determine the need for multi-media filtration (MMF) ahead of an RO system:
- ✔
Silt Density Index (SDI) > 3 — feed water has enough fine colloidal material to foul the membrane within months without upstream filtration. - ✔
Turbidity > 0.2 NTU — visible-particle load is high enough to clog cartridge pre-filters too quickly to be economical.
A well-operated MMF removes particulates down to 15-20 microns. Add a coagulant injection and it removes down to 5-10 microns by causing smaller particles to clump together and become filterable. To illustrate, a human hair is roughly 50 microns across.
Microfiltration (MF) usually with hollow-fiber membranes lowers the definition still further to 0.1-10 microns. MF is the suitable choice in feed water has bacteriological or colloidal problems beyond what mineral media can trap.
For removal of chlorine, decision whether to use granular activated carbon (GAC) or sodium bisulfite (SBS) injection is less transparent than it appears. GAC operates without dosing equipment but eventually provides a home to bacteria because it removes chlorine but also adsorbs organic material for microbes to eat. SBS dosing is metabolically inert but requires an injection pump and chemical inventory. Most large industrial systems choose SBS for that reason; most small commercial systems GAC for ease of operation.
Industrial Applications: Where RO Water Treatment Powers Industry
Reverse osmosis is one of a handful of separation technologies that scales cleanly from a single residential point-of-use (POU) faucet to a 50 TPH point-of-entry (POE) production line. Same physics, same membrane chemistry, same engineering metrics — only the scale and the quality target change. Five industries constitute most of the world’s installed RO capacity, and each commands a different specification target.
| Industry | Quality Target | Faixa de capacidade | Special Requirements |
|---|---|---|---|
| Beverage / bottling | ≥99% TDS rejection | 0.50 T/H | NSF/ANSI 58 and NSF/ANSI 61 certified components |
| Pharmaceutical | USP <645> Purified Water; WFI ≤ 0.25 EU/mL endotoxin | Variável | Qualified / validated system; sanitization protocols |
| Boiler feed water | <1 µS/cm conductivity | Sized to boiler MW | Often paired with mixed-bed deionization |
| Semiconductor | Ultra-pure water (UPW) | High volume | Double-pass + EDI + UV + filtration to nanometer particle level |
| Metal finishing / plating | Low TDS for rinse water | Application-specific | Often polished with DI to prevent water-spot defects |
Beverage and Bottling Applications
For bottled water, soft drinks, and brewing — and for any operation producing potable water at scale — RO water treatment in the beverage industry serves two purposes. It normalizes feed water so the same product tastes the same regardless of municipal source variation. And it lets the producer formulate a consistent ionic profile from a known starting point — adding minerals back for taste, for example — rather than chasing whatever the local water table is doing this month. Beverage-grade RO systems are typically NSF/ANSI 58 and NSF/ANSI 61 certified, run two-stage configurations to hit 75–85% recovery, and integrate with downstream UV or ozone disinfection. If you are scoping or replacing an industrial-scale system, Mass commercial reverse osmosis systems built for beverage manufacturers cover the 0.5 T/H to 50 T/H capacity range with these certifications and pre-treatment trains as standard.
Pharmaceutical Water (USP <645>)
Pharmaceutical RO is a different engineering problem. The bulk water standards published by the United States Pharmacopeia in USP General Chapter <645> define conductivity-based purity tests for Purified Water and Water for Injection. Producing water that meets the standard is the easier part — system qualification, sanitization protocols, and the documentation trail required for FDA inspection are the hard part. Most pharmaceutical RO trains run double-pass with downstream electrodeionization (EDI) and UV, and the system is part of a quality management system, not just an asset.
Boiler Feed Water and Power Generation
High-pressure boilers, including those in combined-cycle power plants, need feed water with extremely low dissolved solids — typically below 1 µS/cm conductivity — to prevent scaling on tube surfaces and corrosion of downstream piping. RO does the bulk separation; mixed-bed ion exchange or EDI does the polishing. A typical large industrial RO train for boiler feed runs 70–80% recovery with the concentrate often recycled into a cooling tower or wastewater treatment loop. Failure to specify enough membrane area at the design stage is the single most common cause of long-term boiler tube fouling, which is far more expensive to fix than oversizing the RO system at purchase.
RO System Maintenance: Filters, Membranes, and Monitoring

Monitoring schedules are monotonous until the membrane fails six months early because the sediment pre-filter wasn t replaced timely. All RO systems- residential through industrial- are operated on the same logical path: monitor a small group of parameters, baseline against reference data, change consumables preemptively and clean the membrane before normalized data drifts beyond defined limits.
| Component | Replacement Interval | Replacement Trigger |
|---|---|---|
| Sediment pre-filter | 6–12 months | Pressure drop > 15% across filter |
| Carbon pre-filter | 6–12 months | Chlorine breakthrough detected at outlet |
| RO membrane (residential) | 2–3 years | Permeate TDS reaches 30–35% of feed TDS |
| RO membrane (industrial) | 3–5+ years | ±15% deviation from baseline normalized data |
| Post-filter | 6–12 months | Annually or with membrane change |
| Storage tank pressure | Check annually | Should hold 7–8 psi when empty |
Membranes are not replaced at regular intervals. They are replaced based on the data. The normal practice is to record baseline normalized permeate flow, normalized pressure differential, and normalized salt passage values at commissioning (or directly after cleaning), then track them monthly. When any of these parameters change by more than15 percent, then a cleaning is indicated. If cleaning does not restore the membrane performance, then the membrane has reached the end of its service.
💡 Quarterly RO Health Check
- Record feed, permeate, and concentrate pressure and flow
- Measure feed and permeate conductivity; calculate salt rejection
- Compare results to commissioning baseline
- Inspect pre-filter housings for cracks, scale, or biological growth
- Check storage tank pressure with a tire gauge
- Verify chemical injection pumps (antiscalant, SBS) are dosing correctly
2026 Outlook: Regulations, PFAS, and Where RO Technology Is Going
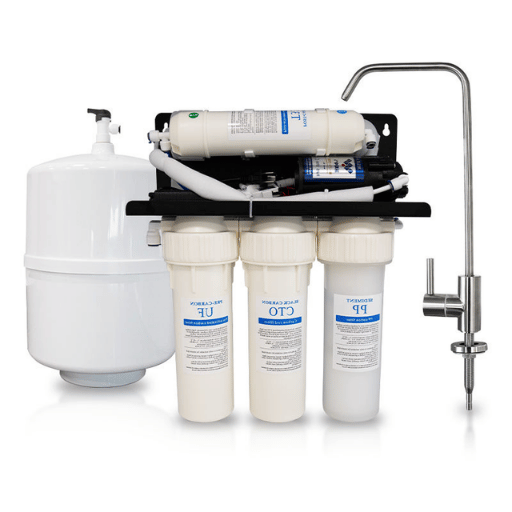
RO though is a proven technology. However, changes in regulatory environment and market pressures are pushing its boundaries. Here are three forces that affect system specifications and how the buyers perceive their value.
EPA WaterSense for Point-of-Use RO (November 2024 Specification)
In November 2024, the U.S. EPA released the final WaterSense Specification for Point-of-Use Reverse Osmosis Systems. Criteria require NSF/ANSI 58 certification plus a wastewater ratio of 2.3 gallons of reject water or less per gallon of treated water. For context, a typical residential RO system wastes about 5 gallons per gallon of treated water; inefficient designs go as high as 10:1. A WaterSense-labeled unit saves an average of 3,100 gallons per year — about 47,000 gallons over the system’s lifetime. If every RO system sold in the United States carried the label, the nationwide savings would be 3.1 billion gallons per year.
PFAS Removal Becomes a Procurement Driver
EPA has indicated that the ability to remove PFAS will become a baseline specification for all residential and commercial procurement in affected areas. The EPA explicitly states that RO is a technology that can treat up to 99% of some PFAS compounds, and published research through the National Library of Medicine demonstrates that many municipal drinking water utilities are beginning to use them for micropollutant removal. For 2026 buyers; it will be much more difficult to rationalize an unsubstantiated system without PFAS removal data, especially when fully designing a new build in a groundwater contamination zone.
Market Outlook 2026–2033
Industry analysts estimate the global water treatment systems market at approximately $45.15 billion in 2025, growing to $97.93 billion by 2033. Grand View Research puts the reverse osmosis segment at an 8.6% CAGR between 2026 and 2033, with Asia Pacific as the largest revenue-generating region. Reverse osmosis already accounts for roughly 55% of installed water purifier technology share. The membrane sub-segment alone is projected to grow from $5 billion in 2026 to $9 billion by 2033 at an 8.7% CAGR.
What this means in practice: equipment availability is good, lead times are stable, and the engineering knowledge base is well-distributed. But the regulatory floor is rising — both PFAS limits and water-efficiency expectations — which is making older inefficient systems uneconomical to keep running compared to a higher-recovery, NSF/ANSI 58-certified, WaterSense-labeled replacement.
Key Factors to Consider in 2026
- When choosing solutions for residential or light commercial applications, use WaterSense labeled systems – (the 2.3:1) wastewater ratio over 10 years adds up to real cash on your water bill.
- Check for certification on contact parts through NSF/ANSI 58 and 61 for applications in beverage and pharmaceutical industries.
- For new groundwater projects in PFAS-impacted areas, specify documented PFAS removal performance (not just generic membrane specs).
- Always demand the complete pre-treament chain in the offer – not only the RO skid – for all commercial systems. Pre-treatment scope determines whether the system actually reaches its rated lifespan.
Sobre Esta Análise
This guide combines U.S. EPA WaterSense documentation, NSF/ANSI 58-2022 certification scope, USP <645> conductivity standards, and industry engineering practice on recovery, salt rejection, and flux calculations. The market and growth figures cited come from Grand View Research, Precedence Research, and Persistence Market Research 2025–2026 publications. Historical context for reverse osmosis draws from the 1959 Loeb-Sourirajan work at UCLA Chemical Engineering. Tecnologia Mass reviewed the engineering portions of this guide based on its experience designing industrial RO systems for beverage and bottling lines.
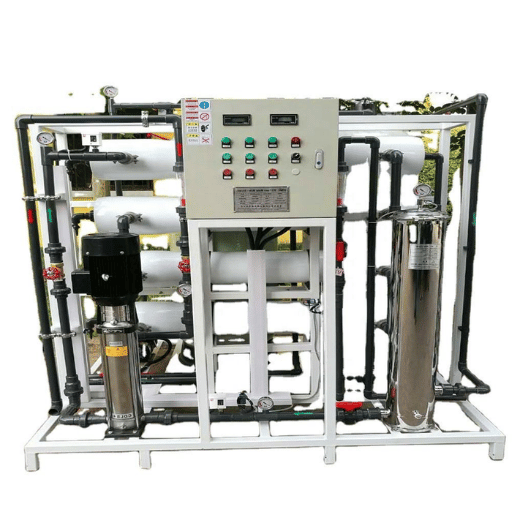
If you are evaluating RO water treatment for industrial, beverage, or commercial applications, explore Mass’s commercial and industrial reverse osmosis range from 0.5 to 50 T/H, built to NSF/ANSI 58 and NSF/ANSI 61 with full pre-treatment integration. For specification questions tied to a specific water analysis, contact the Mass engineering team for a sizing discussion.
Perguntas frequentes
Q: Is RO water safe to drink long-term?
Ver Resposta
Sim, com uma nuance A água RO é segura e é amplamente utilizada como água base para água engarrafada, fórmula infantil e formulações farmacêuticas O RO remove minerais naturais como cálcio e magnésio junto com contaminantes, razão pela qual alguns sistemas incluem um pós-filtro de remineralização para adicionar uma pequena quantidade de minerais benéficos de volta Para pessoas em dietas com restrição de sódio, o RO é ativamente recomendado porque remove o sódio que os amaciantes de água de troca iônica adicionam à água.
Q: How much does an RO water treatment system cost?
Ver Resposta
O custo varia amplamente pela capacidade As unidades de bancada funcionam $100 sistemasTP4T.000. os sistemas Under-ink com 35 estágios caem na faixa $15 residencial$50. RO de casa inteira fica na faixa $1,000$5,000+ e os sistemas industriais começam em torno de $5,000 e passam bem por $20,000 para patins de maior capacidade com trens de pré-tratamento completos Manutenção anual (substituição), substituição de membrana amortizada, higienização ocasional (geralmente $100$4T400 para residenciais e balanças com tamanho para industriais.
Q: What are the disadvantages of RO water treatment?
Ver Resposta
Três desvantagens reais que valem a pena entender Primeiro, os resíduos de água (sistemas residenciais típicos enviam 5 galões para drenar para cada galão de permeado produzido, embora os sistemas marcados com WaterSense reduzam isso para 2,3:1 ou melhor Segundo, o mineral RO tira cálcio, magnésio, outros minerais que contribuem para provar um filtro de remineralização de sabor compensa isso Terceiro, produção lenta Uma membrana residencial produz apenas 23 onças por minuto, razão pela qual um tanque de armazenamento é essencial Os sistemas industriais não têm o problema de velocidade, mas têm um custo inicial mais elevado e requerem pré-tratamento disciplinado.
Q: Does RO water treatment remove bacteria and viruses?
Ver Resposta
Mechanically, yes — bacteria and most viruses are larger than the membrane’s effective pore size and are physically excluded. But residential RO systems are not certified for microbiologically unsafe water on their own. The O-ring seals are not designed to be biotight under all conditions, and bacteria can multiply on the membrane surface if biofilm builds up. If the feed water source is microbiologically suspect — well water in particular — pair the RO with UV disinfection downstream of the storage tank. UV is the certified microbiological barrier; RO is the dissolved-contaminant barrier.
Q: How long does an RO system last?
Ver Resposta
The membrane and the system are two different questions. Residential RO membranes last 2–3 years; the system itself — housings, pump, storage tank — runs 5–10 years before any major component replacement. Industrial RO systems run 15–20+ years with proper maintenance, with membranes replaced every 3–5 years and pumps and pressure vessels rebuilt or replaced once during that life. What drives lifespan more than any other variable is pre-treatment quality, not membrane brand.
Q: RO vs UF vs distilled water — which is better?
Ver Resposta
They solve different problems. Ultrafiltration (UF) has a larger pore size than RO and removes particulates, bacteria, and large molecules but does not remove dissolved salts or most chemical contaminants. UF is the right choice when feed water is microbiologically suspect but already has acceptable TDS. RO removes both particulates and dissolved contaminants and is the right choice when TDS, heavy metals, or PFAS are the concern. Distilled water achieves similar purity to RO but uses far more energy per gallon and is impractical at commercial or industrial scale. For most beverage, pharmaceutical, and high-purity industrial applications, RO is the standard. For point-of-use bacterial control where the dissolved chemistry is already fine, UF is more energy-efficient.
Referências e fontes
- Point-of-Use Reverse Osmosis Systems — U.S. Environmental Protection Agency, WaterSense Program
- WaterSense Specification for Point-of-Use Reverse Osmosis Systems — U.S. EPA, November 2024
- NSF/ANSI 58: Reverse Osmosis Drinking Water Treatment Systems — NSF International
- USP General Chapter <645> Water Conductivity — United States Pharmacopeia
- Reverse Osmosis for Drinking Water Treatment: Implications for PFAS Removal — PubMed Central / NIH
- Reverse Osmosis — Wikipedia (background and historical context)
- Reverse Osmosis Systems Market Statistics — Grand View Research, 2025
- Water Treatment Systems Market Size — Precedence Research, 2025