Get in Touch with Masstech

By GW · Updated October 2026
The best answer to “How to Choose Filling Machine” starts with your product and bottle. Compare the filling method first, then consider shift capacity, changeovers and cost per 1,000 good bottles for the same product and trial conditions.
Before you compare quotations
- Define the liquid, package and product process before choosing a machine size.
- Calculate good bottles per shift, with each time or yield loss counted once.
- Compare the included equipment, annual costs and actual trial results on a similar basis.
Quick Specs
Assumed inputs for the capacity example:
| Product and package | Still beverage in 500 ml bottles |
|---|---|
| Required good output | 12,000 bottles per 8-hour shift |
| Planned time outside production | 90 minutes, including scheduled cleaning and changes |
| Remaining loss factors | 90% availability × 85% performance × 98% first-pass yield |
| Calculated ideal rate required | At least 2,463 bottles/hour before rounding to a suitable design |
Start with your product and package
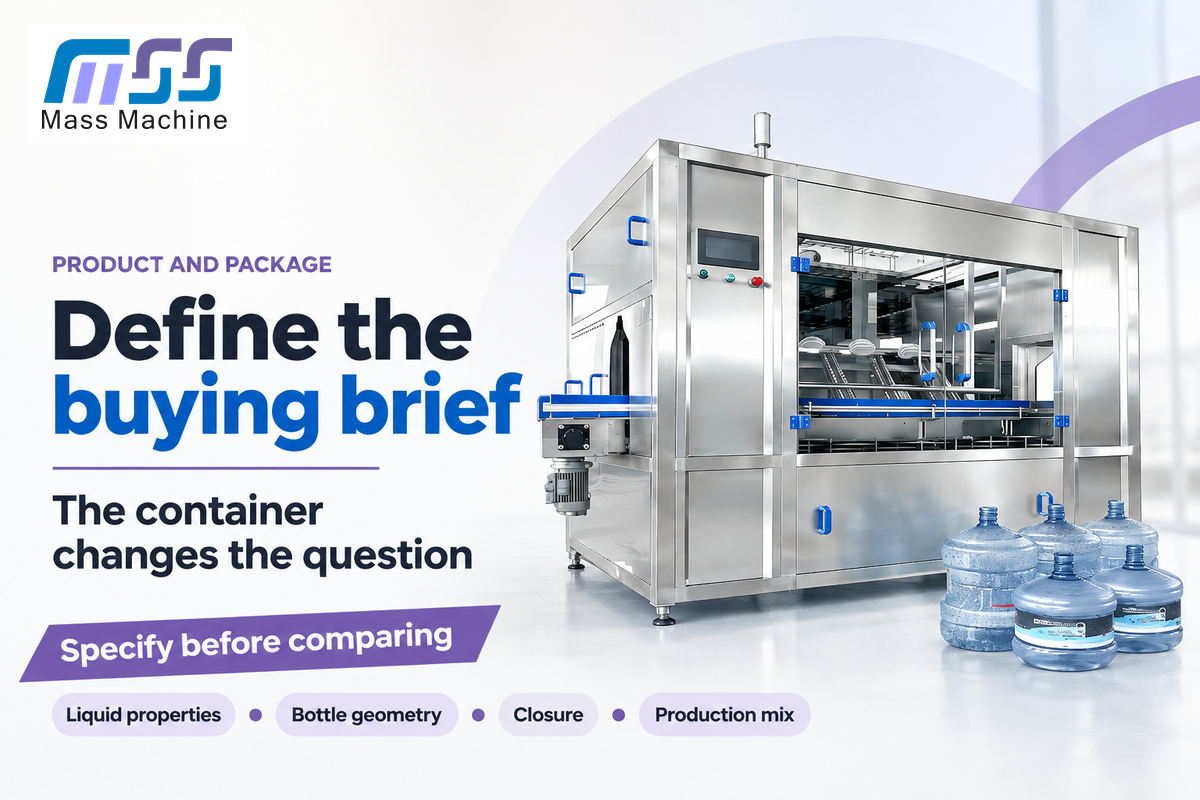
When deciding on choosing a filling machine, also define the liquid products, the package and the process it supports. Viscosity at the filling temperature, foam, particles and dissolved gas affect product handling. Bottle geometry and closure determine transfer and capping requirements. The desired product mix determines the flexibility of the line.
A purchasing spec that only says “500 ml, automatic” provides too little information. A free-flowing water-like product and a viscous liquid containing fruit pieces can require different pumps and valves. Temperature can affect behavior during the filling process, so describe product conditions at filling, not at warehouse conditions.
PMMI ProSource’s liquid-filler buying guide recommends supplying product samples, bottles and temperature/viscosity information for a fill test. When describing the product, include the largest particles, foaming, and sensitivity to product handling. Quality staff should also identify product-family separation needs and the approved changeover requirements for shared equipment.
For a producer planning both a plain drink and a pulpy version, the pulpy formulation deserves its own entry in the product list. Answering the water question is dependent on a successful water demonstration. The second product adds a separate question about passage size, valve behavior and the condition of the product after filling.
A 500 ml launch bottle and a planned 1,000 ml bottle belong in the same purchase brief, with separate drawings and output targets. Increasing the fill volume also increases the amount dispensed per cycle. The larger format bottle should also have its own quoted rate. One “bottles per hour” figure isn’t interchangeable for both products.
Which liquid filling principle matches your product?
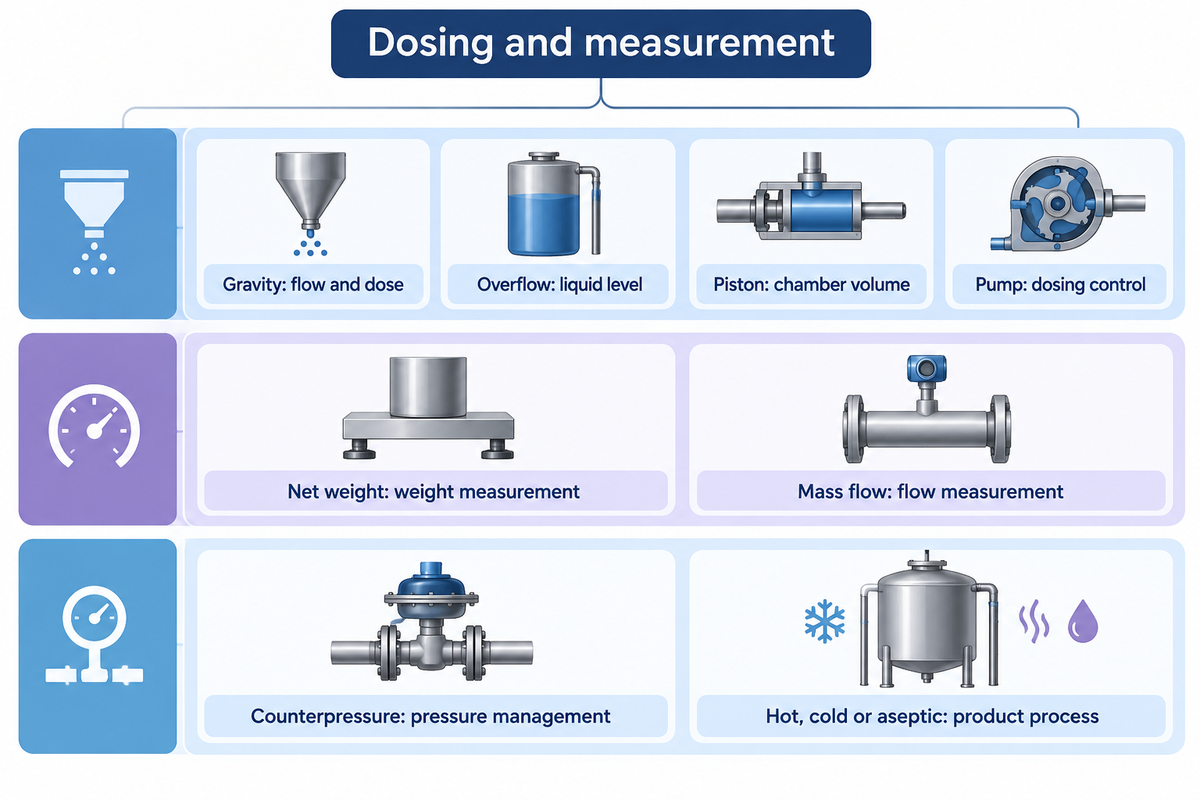
Match the filling principle to the required quantity and product behavior, then specify pressure and preservation separately. Gravity filling and pump-based dosing suit different flow conditions. An overflow filler targets a visible level. Pressure sensitive products may use Counterpressure for product transfer. Hot, Cold and Aseptic processes also bring along additional requirements for the product and package.
What are the different types of filling machines?
Liquid filling machines use gravity, overflow, piston, pump, net weight, mass-flow, vacuum, or counterpressure. The names used for these filling technologies describe different aspects of the system: some define how the dose is measured, while others describe the type of pressure used to transfer it. A system can incorporate several of these principles.
A piston filler dispenses a chamber volume, so piston filling machines are one form of volumetric filling. Pump fillers move product through a selected pump and dosing control. Many factors affect the choice beyond the product’s thickness: passage of solids, product foaming, and how easily product is washed from a surface, to name a few. Principles and characteristics of volumetric filling are described in the FAPC-229 Guide from Oklahoma State University.
| Choice | Decision axis | Product or buying question |
|---|---|---|
| Gravity dosing | Flow and dose control | Can a low viscosity product flow consistently under the proposed supply conditions? |
| Overflow | Target liquid level | Is consistent appearance required, and how will delivered quantity be measured? |
| Piston | Measured chamber volume | Can the product pass through the proposed chamber, valve and nozzle? |
| Pump dosing | Pump and dose control | Does the selected pump suit the viscous product and its handling sensitivity? |
| Net weight | Weight measurement | How is empty-container weight removed from the measured amount of product? |
| Mass flow | Flow measurement | Is the meter suitable for the actual liquid and required dose? |
| Counterpressure | Pressure management | How will the system handle carbonation and foam with the intended container? |
| Vacuum | Pressure difference | Can the package and product tolerate the proposed vacuum filling system? |
| Hot, cold or aseptic filling | Product process | Which process and package have been selected for the beverage? |
The matrix separates dosing choices and process choices. Our CGF water filling specifications page provides tables for the still water family. Juice brings a discussion of product and package requirements shown in our juice filling configurations.
Equal fill heights can mask differing product quantities. Consider two bottle designs that contain 500 and 510 ml, respectively. Suppose two bottle designs hold 500 ml and 510 ml at a shared visible line: filling both to that line gives a 10 ml difference. A buyer comparing filling accuracy should distinguish appearance, measured volume and weight, rather than accepting one as a substitute for another.
How much bottle filling capacity do you actually need?
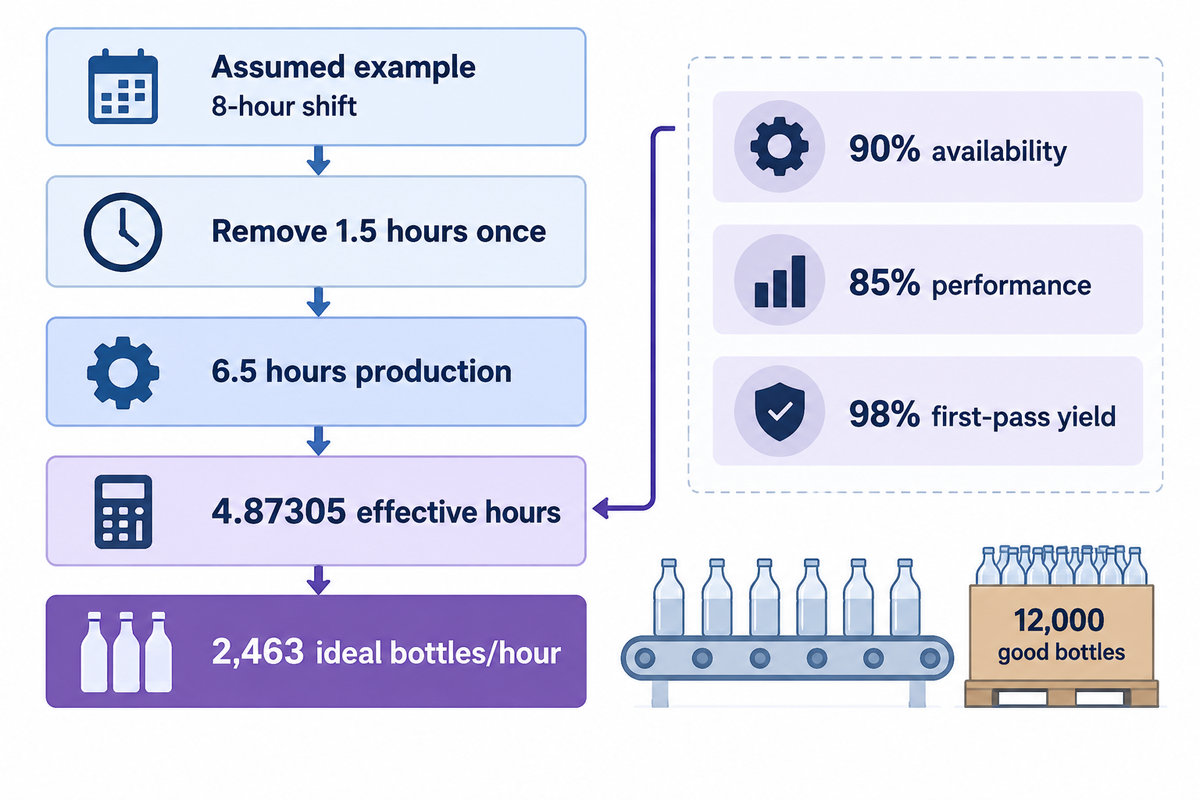
Size a bottle filling machine from required good bottles and usable production time. Divide the target by time, remaining availability, speed performance and first-pass yield. Keep the boundaries separate: scheduled time removed at the start must stay outside the later loss factors. Use the result for a preliminary sizing screen.
4-Loss Capacity Ladder
The briefing states 12,000 acceptable bottles in an 8-hour shift. With 90 scheduled minutes removed, that gives 6.5 hours. Remaining availability accounts for stops within those 6.5 hours; performance reflects slower running and small stops; and yield measures bottles that pass the agreed first-pass checks.
| Input or calculation | Value | Boundary |
|---|---|---|
| Bottle fill | 500 ml | One specified format |
| Good-output target | 12,000 bottles | Passing agreed line checks |
| Calendar shift | 8 hours | Starting time budget |
| Planned exclusions | 1.5 hours | Counted once here |
| Scheduled production | 6.5 hours | 8 − 1.5 |
| Remaining availability | 90% | Excludes the 1.5 hours already removed |
| Speed performance | 85% | Relative to ideal rate |
| First-pass yield | 98% | Good count ÷ total count |
| Effective productive time | 4.87305 hours | 6.5 × 0.90 × 0.85 × 0.98 |
| Ideal rate required | 2,462.52 bottles/hour | 12,000 ÷ 4.87305 |
| Rounded minimum | 2,463 bottles/hour | Screening value, before design selection |
12,000 bottlesrequired good output
6.5 hoursscheduled production
2,463 bottles/hourcalculated ideal rate required
Our published tables list CGF 24-24-8 water and RCGF 24-24-8 juice models separately at 8,000 – 12,000 bottles/hour on a 500 ml basis. These are different product families. Prior to applying loss factors to any quoted rate, determine if the rate is ideal, sustained while running, or already adjusted for stops and changes.
Availability and yield assumptions deserve as much attention as the machine rating. At 75% performance, with the other example inputs unchanged, the required ideal rate rises to 2,791 bottles/hour. At 95% it falls to 2,204 bottles/hour. Measured product trials should replace those assumptions before the final machine size is agreed.
Should you choose inline or rotary filling?
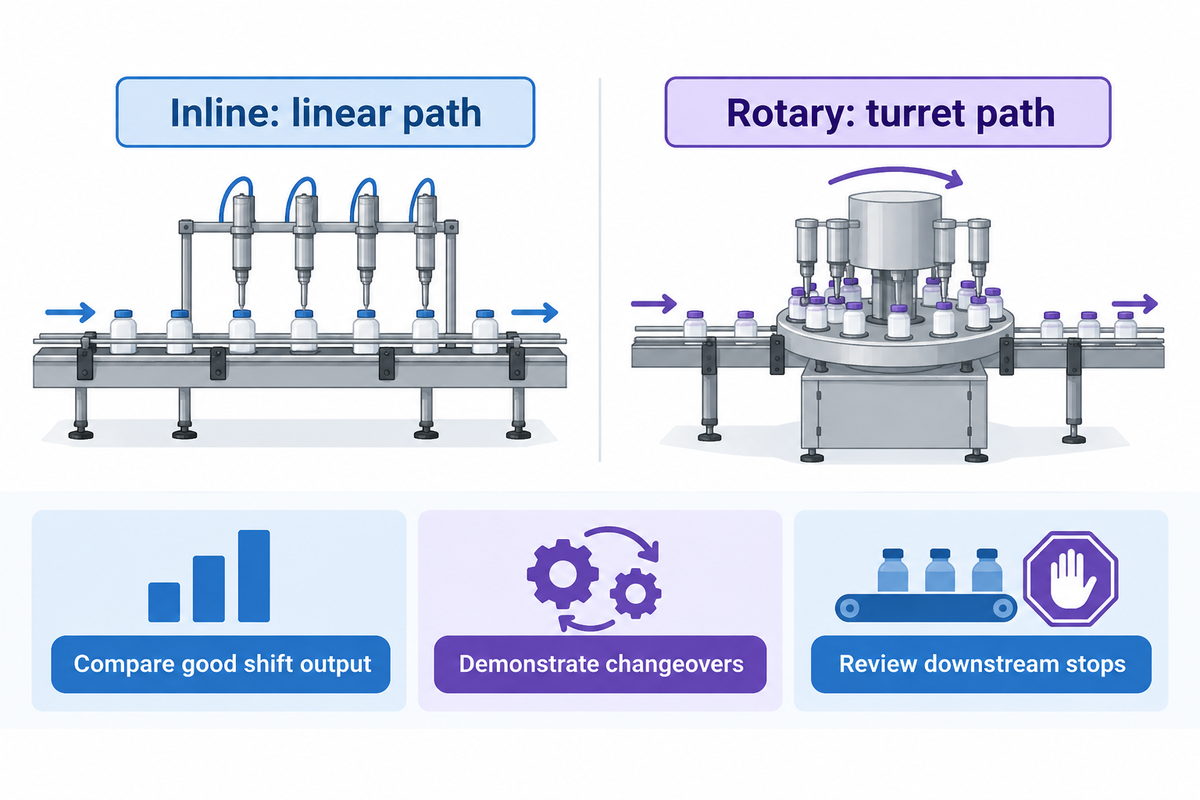
Compare the proposed designs against your business needs and actual production mix to identify the best option between inline and rotary filling. Rotary systems carry containers around a turret, while inline systems use a linear path. Batch length, as well as the time required to change between runs and handle packages, can greatly influence system speed. Compare equal shift output.
An automatic inline system could suit a modular line with frequent product changes. A rotary system can combine filling and capping around synchronized handling. Neither label tells you how many change parts the next bottle needs, how long recovery takes, or how a stopped downstream machine affects the filler.
The NIST-hosted study of multi-product production lines accounts for reliability, finite buffers, and scheduling when it predicts production rate. Here, the same lesson applies: to estimate the production rate of the overall system, look beyond individual speeds of components. Worksheets and computer modeling can provide an initial analysis; complete-line testing is required to validate the combination.
What Is the Difference Between Semi-Automatic and Automatic Filling Machines?
Semi-automatic filling keeps an operator involved in tasks such as presenting containers or starting cycles. Automatic filling machines use automation to move containers and coordinate filling. The distinction is how many tasks are left to be done manually and what the staffing levels and output of the line are.
Compare manual filling, semi-automatic, and automatic filling against the same shift requirement. An automatic filler still needs a reliable product supply and matched downstream equipment. As for the production staff, it’s who loads, replenishes, and clears the line. As for finance, it’s whether the resulting labor and output assumptions match the quote.
Example: Six format changes, which each take 10 minutes, consume 60 minutes; six format changes which each take 30 minutes, consume 180 minutes. The 120-minute difference can outweigh a higher running speed on short batches. Compare the two suppliers’ demonstrated changeovers including restarts, and decide which proposed design offers better production.
What changes when you change product or bottle?
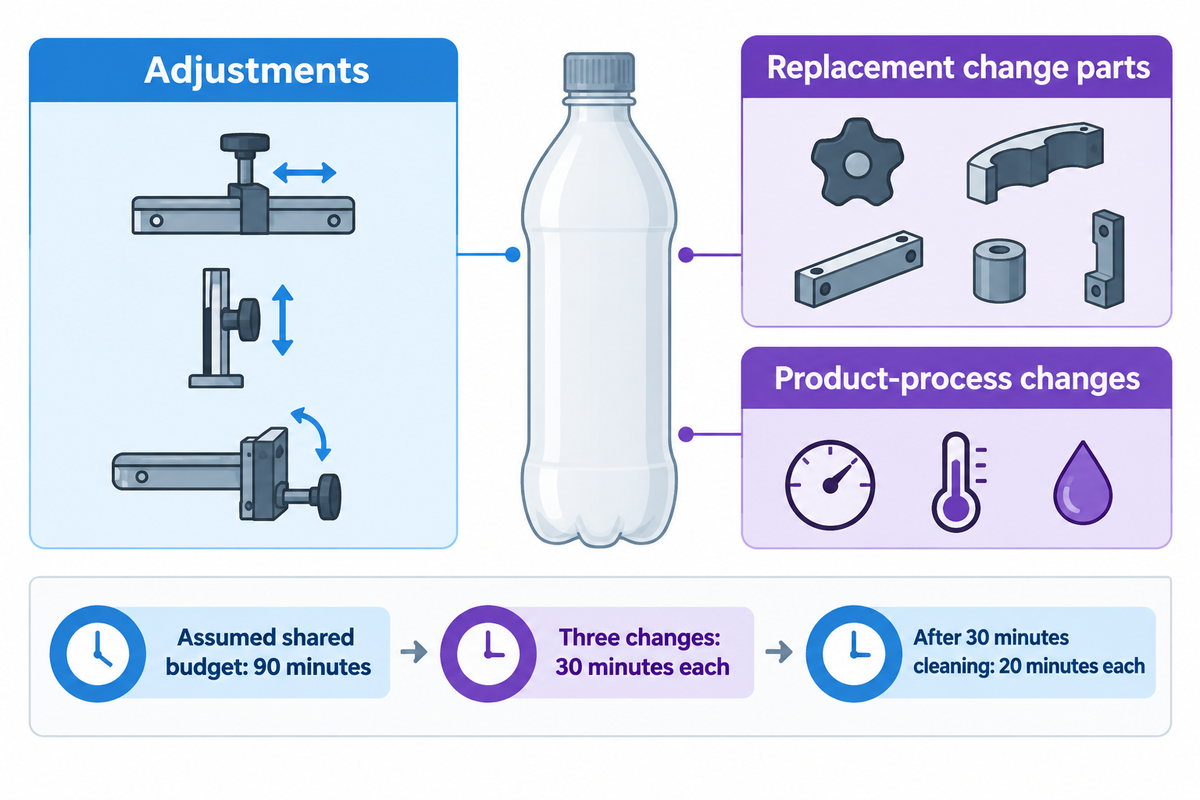
Build a format matrix that distinguishes between adjustments, replacement change parts, and product-process changes. Bottle height alone is insufficient: diameter, neck finish, stability and closure also affect handling. A recipe change on the control screen may adjust settings while leaving physical tooling work elsewhere on the line. Provide the complete changeover in the comparison.
Can one filling machine handle multiple container sizes?
One filling system can handle the required variety of containers within its design range using adjustments or the right change parts. Different bottle shapes may require different guides, star wheels, neck handling, filling height, and closure parts. Compatibility should be determined on a format by format basis. State the required parts and output for each package.
List the smallest and largest formats as well as awkward formats, i.e. an unstable, lightweight bottle; an unusual neck; or a difficult closure. Different container types can share a nominal volume but require different modes of handling. The same review is applicable to the seamer and lid combination when considering can filling and seaming equipment.
State future formats, including a parts list, if possible. Flexibility is more useful when stated as a firm format commitment with a time, cost and quality trade-off. Different products can add contact-part, seal and cleaning requirements even when the bottle stays the same.
A 90-minute changeover and cleaning budget leaves 30 minutes per change when shared by three changes. If cleaning uses 30 minutes of that allowance, only 20 minutes remain per change. The format matrix should expose that trade-off before procurement accepts a faster filler that takes longer to reset.
How should you assess cleaning and product contact design?
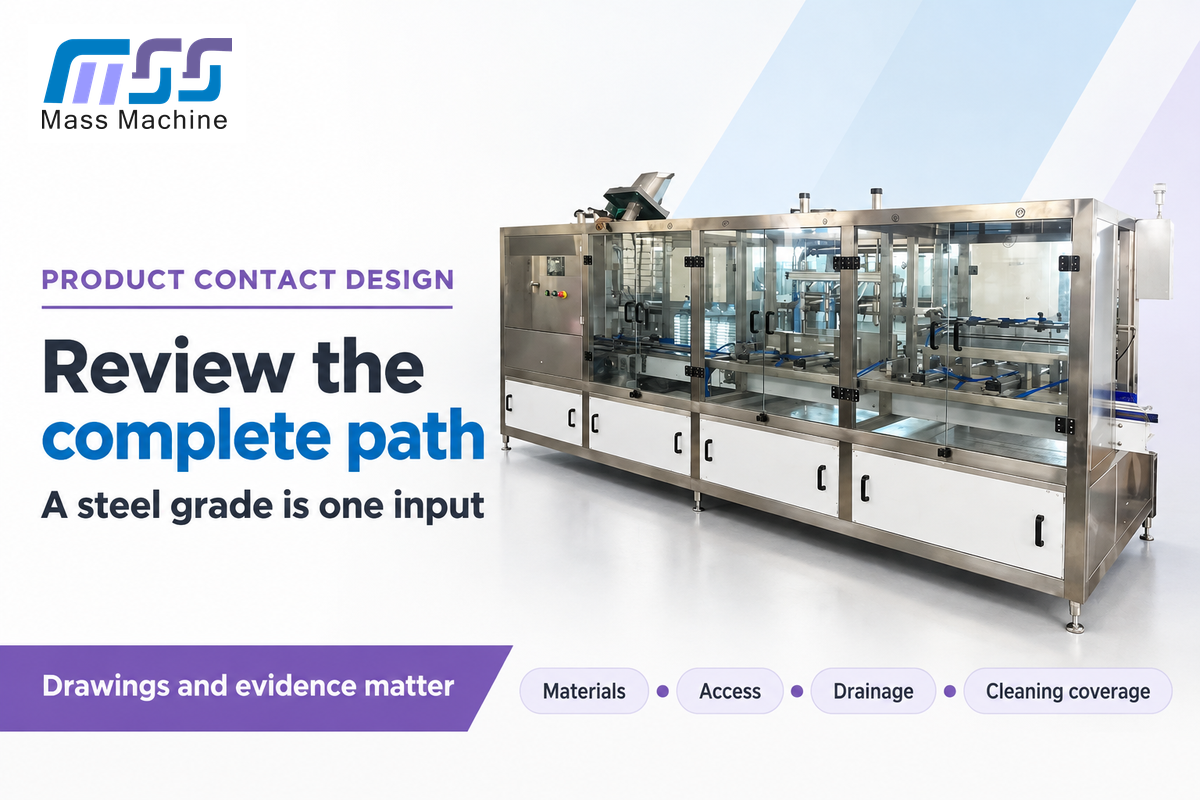
Product contact design should be evaluated with regard to the materials, access, drainage, and cleaning methods required. Steel grade is but one consideration. Seals, hoses, valves and hidden product paths also need review. The quality and maintenance staff should assess whether the proposed design suits their process and inspection requirements.
The University of Florida guide to equipment cleaning treats surface composition, finish and condition as separate cleanability factors. Cleaning and sanitizing are also different tasks. Specify which surfaces must be accessible, which parts need removal and what the proposed clean-in-place arrangement covers.
For a line changing between different products, compare the entire product path rather than the exterior frame. Include the supply side and the filling valve, as well as any return circuit. Residual product, worn seals or other inaccessible areas can increase the effort required to clean and increase the risk of contamination. The processor’s approved method of cleaning determines the design of the equipment and evidence required to demonstrate changeover.
An attractive machine surface finish may be appreciated during equipment purchase; however, this can create extra work for the Quality Assurance team. Resolve that disagreement through a contact-part list, drawings and a demonstration of access. Keep material certificates, machine conformity documents and product-process approval separate; each document should identify its holder and the equipment or material it covers.
What is the cost per 1,000 good bottles?
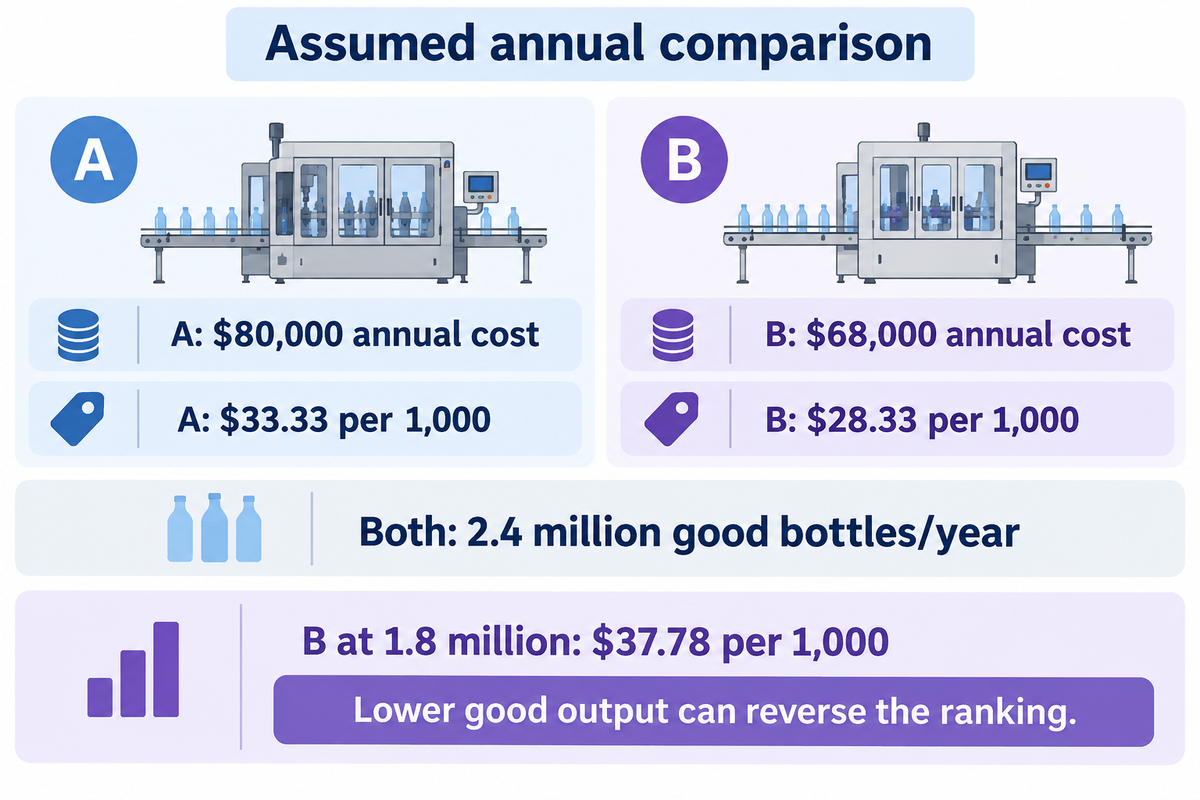
To compare cost per 1,000 good bottles, divide the same included annual cost by the annual acceptable output and multiply by 1,000. Include equipment ownership allocation, labor and running costs within a declared boundary. A lower purchase price can lose its advantage if staffing, product loss or lower good output increases unit cost.
1,000-Good-Bottle Cost Sheet
Cost per good unit is a useful measurement in manufacturing. The yielded-cost research abstract from the University of Maryland explains an effective cost per non-defective assembly and how the denominator can drive the analysis. In a bottle comparison, rejected output isn’t included in the good output.
Assumed inputs: Option A costs $180,000 installed and Option B $240,000. Both use a 10-year straight allocation and produce 2.4 million good bottles annually. The following annual expenses are example inputs; packaging materials and the beverage itself, except modeled product loss, are outside this conversion-cost comparison.
| Annual item | Option A | Option B |
|---|---|---|
| Installed cost ÷ 10 years | $18,000 | $24,000 |
| Direct labor | $36,000 | $24,000 |
| Utilities | $6,000 | $5,000 |
| Maintenance and spares | $9,000 | $8,000 |
| Cleaning consumables | $5,000 | $4,000 |
| Product loss | $6,000 | $3,000 |
| Included annual total | $80,000 | $68,000 |
| Annual good bottles | 2,400,000 | 2,400,000 |
| Included cost per 1,000 good bottles | $33.33 | $28.33 |
The calculation is $80,000 ÷ 2,400,000 × 1,000 = $33.33 for A, and $68,000 ÷ 2,400,000 × 1,000 = $28.33 for B. Production must be able to deliver the denominator finance uses. Avoid adding a separate downtime charge for the same lost output already reflected in fewer good bottles unless it represents a distinct cash expense.
A full lifetime comparison goes further. The U.S. Department of Energy’s life-cycle-cost training includes repair, replacement and disposal as well as acquisition and energy, and considers life and discount factors. Keep those items explicit when extending this annual screen to the full ownership period.
Option B’s apparent advantage reverses if its included annual cost stays $68,000 but good output falls to 1.8 million bottles. Its cost becomes $37.78 per 1,000, above A’s $33.33. The $60,000 higher installed price is therefore only one decision input; demonstrated good output must support the labor and running-cost assumptions.
How should you compare suppliers and acceptance trials?
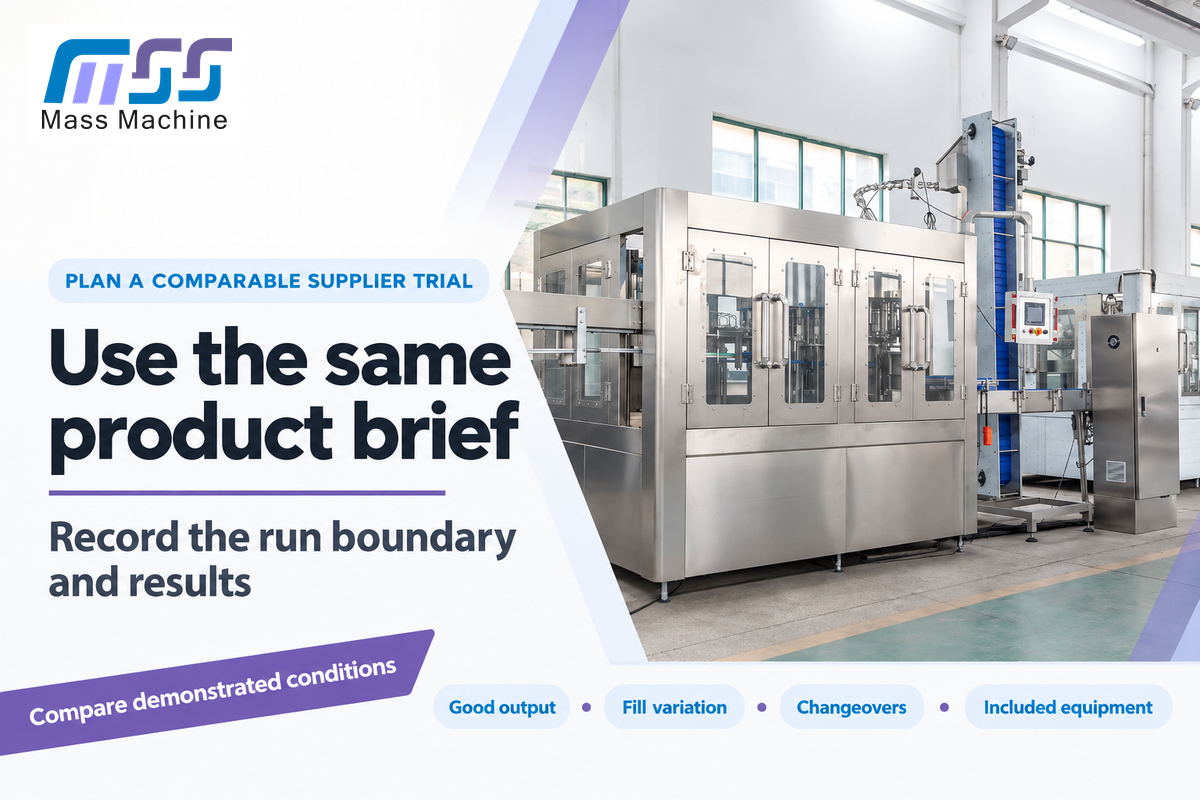
Compare suppliers using the same product brief and observation sheet. Record the run boundary, total output, good output and fill measurements using the same bottles, closures and product condition. Decide the filling procedure and acceptance criteria prior to the trial to help detect whether an attractive average is masking considerable variation or a high level of rejects.
Complete the following fields in a quotation request and trial record. Production owns the definitions of output and time; quality owns the acceptance and measurement criteria; procurement owns the description of the offer. The observation sheet applies to the complete proposed scope, including the downstream equipment that must keep pace.
| Record | Buyer input or result | Decision supported |
|---|---|---|
| Product | Formulation, temperature in °C, viscosity and particles | Filling method and product handling |
| Package | Fill in ml; bottle drawing; neck; closure | Transfer, dosing and closure fit |
| Time boundary | Elapsed minutes; included stops and changes | Comparable sustained output |
| Counts | Total, first-pass good and rejected bottles | Usable output and yield |
| Fill measurements | Individual results in ml or g; method and sampling plan | Mean, variation and agreed acceptance |
| Format change | Minutes, staff, parts and restart checks | Actual production-mix burden |
| Product path | Contact parts, access and cleaning coverage | Quality and maintenance fit |
| Line behavior | Blocked/starved periods and downstream recovery | Integration and bottleneck risk |
| Commercial scope | Equipment, tooling, installation, training, spares and service | Comparable delivered offers |
Pressure-sensitive products require us to describe the beverage rather than just saying “thin liquid.” Talk about carbonation and foaming in the brief for the carbonated drink filling line. Likewise, a brewery has to state the product and package conditions when reviewing beer filling options. Filling products successfully under one set of conditions does not settle a different product trial.
Check integration and utility requirements before ordering
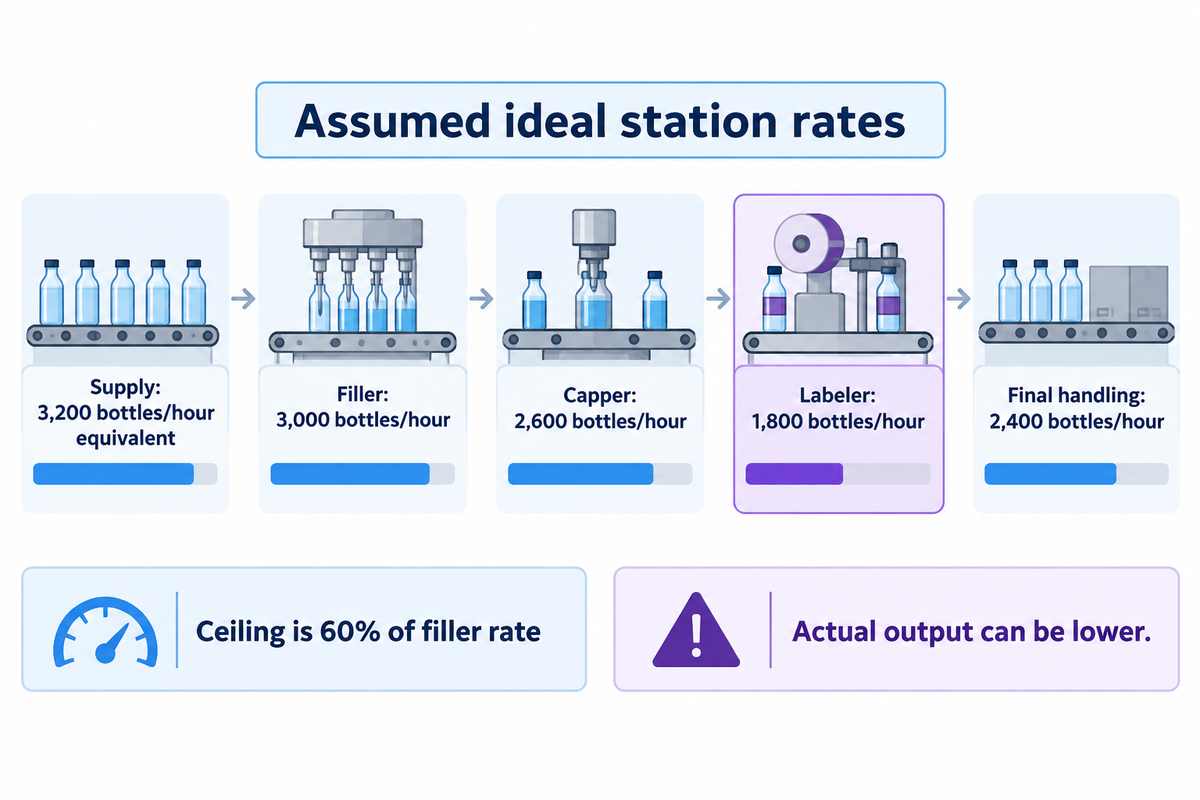
Check the complete packaging line before ordering the filler: product supply, container feed, conveyor transfers, capper or seamer, labeling machine and final handling must work together. Confirm layout, controls and utilities against the proposed design. A faster filling station adds little capacity if another station blocks it or supply is constrained.
“The filler must integrate with upstream and downstream equipment and controls.”
Automatic filling equipment requires a stable supply and clear interfaces. Show electrical and air requirements, water and cleaning connections, drains, and service accesses on the layout. Distinguish the filler’s demand from the complete line’s demand; an upstream process unit or packing machine may add substantial requirements of its own.
| Station | Assumed ideal rate | Interface to examine |
|---|---|---|
| Product/container supply | 3,200 bottles/hour equivalent | Supply interruptions |
| Filler | 3,000 bottles/hour | Starved or blocked periods |
| Capper | 2,600 bottles/hour | Closure feed and rejects |
| Labeler | 1,800 bottles/hour | Lowest nominal rate |
| Final handling | 2,400 bottles/hour | Accumulation and recovery |
Anticipated product variety also belongs on the drawing. Demand for more versatile machinery is attributed to the launch of new products and formats, per the June 2025 PMMI packaging summary. The same demand is reported in a 2026 feature in the Beverage Industry. Interpret the need as next defined formats and change parts and interfaces.
The example labeler’s 1,800-bottle/hour ceiling equals 60% of the filler’s nominal rate. Buffers can absorb small interruptions, but not the long-term capacity mismatch. Actual throughput can be lower still because of stops and machine interactions. Address the constraint at the station of interest, before you pay for additional filling heads that the line cannot use.
FAQ
What is the working principle of a vacuum filling machine?
A vacuum filling system uses a pressure difference to draw liquid into a container.
The package must tolerate the proposed vacuum, and the liquid’s gas and foaming behavior matter. Residual dissolved gas can make a product behave differently from a genuinely still liquid. Specify the actual product and container when comparing this filling method. The buying question is whether the proposed arrangement delivers the required quantity and appearance with that product, rather than whether vacuum works for liquids in general.
Can a volumetric filling machine work with both liquids and pastes?
A volumetric filling machine can handle liquids or pastes when its dosing and product path suit those materials.
Volumetric describes the measured volume, rather than one universal machine design. A piston, pump, valve and nozzle combination has a particular working range. Thin liquids, thick pastes and products containing particles place different demands on that path. The quotation should identify the products covered and the parts required for each. Demonstrated product handling matters more than a broad “liquid and paste” label on the equipment.
What does cold filled mean?
Cold filled describes a product filled without using a hot-fill temperature at that stage.
The term describes the filling condition, while the beverage’s preservation process and storage conditions are separate specifications. A cold-filled product may require different upstream treatment, packaging or distribution from another beverage. Buyers should state the selected product process alongside the required filling temperature. Choosing a cold-fill machine by itself does not set shelf life or make different formulations interchangeable on the same line.
How is can filling machine capacity measured?
Can filling capacity is commonly stated in cans per hour, with the can size and product conditions specified.
A 12,000-cans/hour figure is a rate, not the good output of an entire shift. Distinguish running speed from shift output after changes, stops and rejects. Compare seamer and downstream rates using the same can and product basis.
Can I retrofit my old filling machine, or should I replace it?
Retrofit a sound, product-compatible machine when the limiting parts or controls can be changed economically; replace it when the required process exceeds its practical design.
Start with the loss record and product requirements. Handling adjustments, change parts or controls may address one bottleneck, while a different filling principle or inaccessible product path can make replacement the better option. Compare the complete retrofit scope, outage and future support with the replacement offer.
A historical University at Buffalo case about Mentholatum reports 50% less filling-line changeover time and 100% higher throughput with no capital cost. The healthcare manufacturer’s program began in 2009; this was a process-improvement case, rather than a beverage-machine comparison. Its useful lesson is to examine existing losses before assuming that more nominal speed requires a new filler.
Use the same production mix for both proposals. A cheaper retrofit can lose its advantage if it leaves recurring product losses or prevents the next required format, just as a new machine can disappoint when the real constraint remains downstream.
What is the difference between a filling machine and a capping machine?
A filling machine dispenses product; a capping machine applies or secures the closure.
An integrated monoblock can combine those functions. The two stages still need compatible container handling and matched output. Compare filling and closure rejects separately so a good fill does not conceal a cap problem that reduces acceptable finished bottles.
How does bottled-water production cost differ from the filler price?
Bottled-water production cost includes the product, packaging and complete operation; the filler price covers only its quoted equipment scope.
Bottle or preform supply, caps, labels and secondary packaging belong in a finished-product budget. Water treatment, utilities, labor, maintenance and distribution add further costs. A liquid filling equipment quotation may include some associated machines and exclude others, so compare its boundary before using it as a plant budget. The cost sheet in this guide isolates selected ownership and conversion costs; add the omitted product and packaging costs when planning the finished bottle.
Key takeaway
Choose the filling machine for your business around product fit, acceptable shift output and a common cost boundary. Use the Capacity Ladder to screen size, the Cost Sheet to expose trade-offs, and the same-product trial to settle the purchase.
Send Mass Technology your product details, package drawings and required good bottles per shift. We can use the brief to discuss the filling family and the scope for quotation. Discuss your product and production target
About this filling-machine comparison
GW has developed this guide to assist buyers in reviewing liquid filling machinery and complete beverage lines. Mass Technology’s product pages supply the attributed model examples. The capacity and cost worksheets use stated assumptions, and members of the production, quality and purchasing teams are encouraged to replace the assumptions with their measurements and quotes. The buying methods are supported by published research. The examples don’t represent customer installations.
References & Sources
- Filler Identification and Selection for Liquid Foods, FAPC-229 Timothy Bowser, Oklahoma State University Extension, 2019.
- Nine Tips For Buying a Liquid Filling Machine PMMI ProSource, 2021.
- Basic Elements of Equipment Cleaning and Sanitizing University of Florida IFAS Extension.
- Performance Analysis of Multi-Product Bernoulli Lines with Dedicated Finite Buffers Feng, Park and Li, 2017; public abstract.
- Using Yielded Cost as a Metric for Modeling Manufacturing Processes Becker and Sandborn, University of Maryland, 2001; public abstract.
- Take Five: Life Cycle Costs for Acquisition U.S. Department of Energy, 2024.
- The Mentholatum Company University at Buffalo TCIE, historical improvement case.
- Beverage Packaging Industry Responds to Rapid Transformation PMMI, June 2025.
- Beverage Brands Seek Filler Technology That Supports Flexibility, Adaptability Chloe Alverson, Beverage Industry, March 2026.